
Summary Statistics
Latest version: 5.0.1 build 703. July 3, 2026.
The Summary Statistics plugin adds automatic statistical calculation to all our data loggers. It provides key metrics such as sum, average, minimum, maximum, first value, last value, and quality of service over flexible time intervals. You can apply these calculations to any numeric parser variable, including variables that match a wildcard mask, and export the results as new parser variables with clear suffixes. It helps you get simple data flow analytics of device data into structured summary records that can be saved, used in dashboards, or processed further in other systems.
Configuration of the plugin is straightforward. You define one or more parser variables, choose an interval, and then select the statistical totals that you want to compute. For each configured variable, the plugin creates a set of derived variables such as VALUE1_MIN, VALUE1_MAX, VALUE1_AVG, VALUE1_SUM, VALUE1_FIRST, VALUE1_LAST, VALUE1_TSS, VALUE1_TSE, and VALUE1_QOS. These derived variables flow through the logger pipeline just like normal parser variables and can be used in exports, scripts, or notifications.
The plugin also evaluates data quality through a quality of service metric. You specify the expected number of values per interval, and the module computes the ratio between processed and expected values. This gives you instant feedback on data completeness and can highlight device failures, communication issues, or gaps in data acquisition. When the expected value is zero, the same quality of service variable instead reports the raw count of processed values in the interval.
In typical use, the Summary Statistics plugin helps you transform streams of sensor readings, device counters, or register values into compact summary records. For example, you can calculate energy consumption per device per hour, monitor minimum and maximum temperatures every 15 minutes, or compute average response times per day. The results can be exported to CSV files, databases, or MQTT brokers using existing export plugins in our loggers, enabling integration with SCADA, MES, or BI platforms.
Integration example with Advanced Serial Data Logger
Consider a production line where a device sends a numeric temperature value every 10 seconds over a serial port. Advanced Serial Data Logger receives raw strings such as:
2026-01-02 08:00:00;DEVICE01;TEMP=21.3
2026-01-02 08:00:10;DEVICE01;TEMP=21.7
2026-01-02 08:00:20;DEVICE01;TEMP=22.0
2026-01-02 08:00:30;DEVICE01;TEMP=22.4
...
Assume, a parser module extracts DATE_TIME_STAMP, DEVICE_ID, and TEMP as parser variables. You configure the Summary Statistics plugin with:
- Parser variables: TEMP
- Interval: Fixed, 30 minutes
- Totals: Minimum, Maximum, Average, First value, Last value, Start time, End time, Quality of service
- Expected number of values per interval: 180 (one reading every 10 seconds)
During the interval from 2026-01-02 08:00:00 to 2026-01-02 08:30:00, suppose the device sends 170 valid values. At 2026-01-02 08:30:00, the plugin exports one summary line. Internally, the parser variables at export time might look like:
DATE_TIME_STAMP = 2026-01-02 08:30:00
DEVICE_ID       = DEVICE01
TEMP_MIN        = 21.3
TEMP_MAX        = 24.8
TEMP_AVG        = 23.1
TEMP_FIRST      = 21.3
TEMP_LAST       = 24.2
TEMP_TSS        = 2026-01-02 08:00:00
TEMP_TSE        = 2026-01-02 08:30:00
TEMP_QOS        = 0.9444
If you enable "Export only total values", the logger will not forward individual TEMP readings to subsequent modules. Only the summary record will be passed to the CSV export, database writer, or other destinations. This greatly reduces data volume and get onlt total numbers. If you leave this option disabled, you can keep both raw and aggregated data, providing maximum flexibility for analysis and troubleshooting.
Key features
- Flexible interval options including continuous, fixed, and Cron-based aggregation.
- Support for multiple parser variables and wildcard masks for large variable groups.
- Computation of minimum, maximum, average, sum, first value, last value, and time boundaries.
- Quality of service calculation based on expected or actual value counts.
- Per-device statistics using a configurable device ID parser item.
- Option to export only total values or to enrich the stream while keeping source data.
Summary
The Summary Statistics plugin calculates concise, structured summary records that are easier to store, analyze, and visualize. With flexible intervals, grouping by a device, and quality of service metrics, it fits well in both simple logging tasks and complex industrial monitoring projects.
How to enable this plugin
The figure below shows how to select the plugin on the "Modules" page.
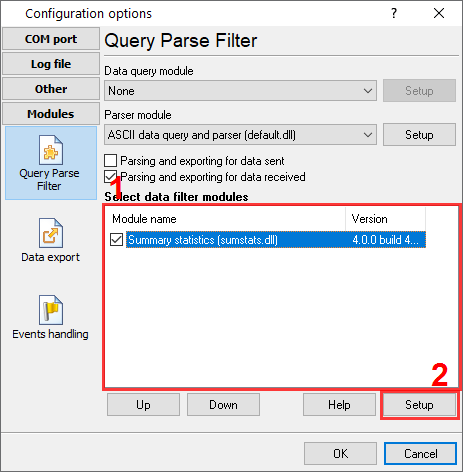
Fig.1. Selecting the plugin.
How to configure the plugin
The figure below shows how to configure the plugin. Please, look at the documentation for the full description of all settings.
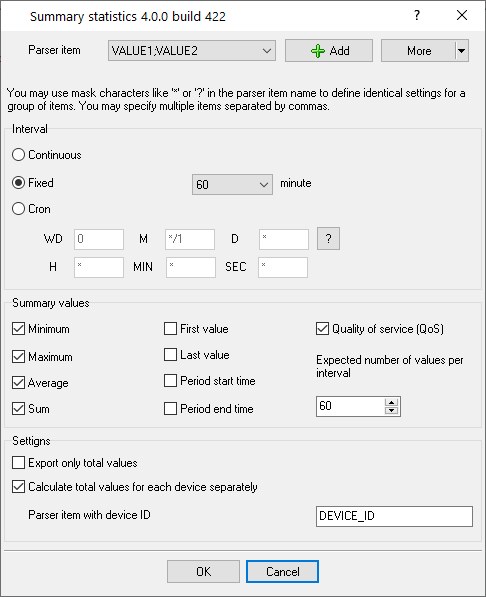
Fig.2. Configuring the plugin.
Read more about other plugins:
All plugins | Deadband | Expressions | Aggregator | Digital inputs filter | Script execute | Events generator | Redirect data | Redirecting data to a TCP server | Data timeout | Alarms Professional | Data Encode | Data From List | Failover | Summary statistics