
Read sensor's data via an HTTP CGI interface
Problem:
The HTTP interface is a very simple and easy way to read sensor's values, which has a static IP address or DNS name.
There are many IoT devices or sensors that provide the HTTP API to retrieve measurements. For example, you can open a link like "http://127.0.0.1:8080/data?id=1234" in your browser and get the necessary value.
This 'how to' shows how to automate data reading from these devices or sensors and export data via OPC, write to Excel or database in real-time.
FIY: We use a data stream from GILL MetStream in this article.
Preliminary requirements:
- Data Logger Suite: Logging and Monitoring. License type: Professional, Enterprise, or a trial version
- ASCII Data Query plugin (it comes with the regular installation above).
Solution:
Configuring HTTP data source
1. Click the "Plus" button in the main window and configure TCP settings:
- 1.1. Select the "HTTP Client" mode.
- 1.2. Add your link to the "Remote host" list. If your link contains parameters after "?", you should omit these parameters, including the "?" character.
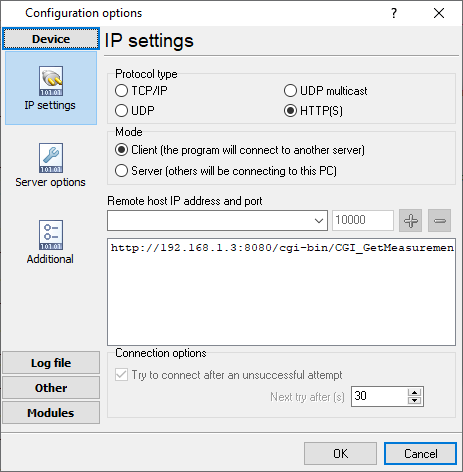
Fig. 1: HTTP data source settings
2. Go to the "Modules - Query Parse Filter" tab and select the "ASCII Data Query And Parser" plugin from both drop-down lists. Then click the "Setup" button.
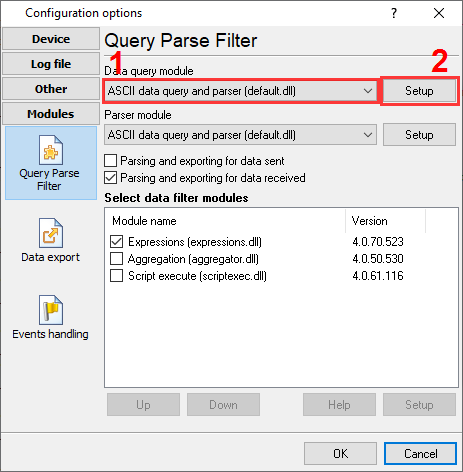
Fig. 2: Select a data query plugin
3. Go to the "Query - Requests" tab and add a new request by clicking the "Add item" button.
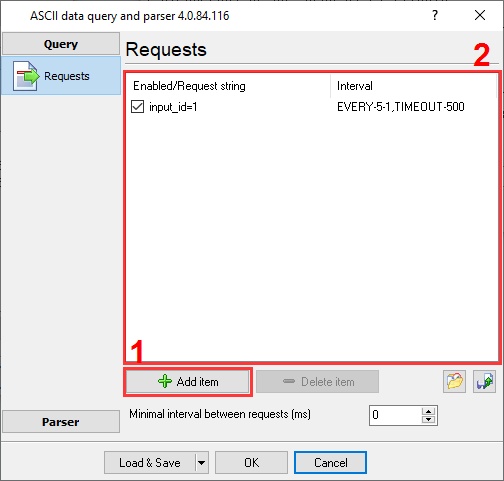
Fig. 3: Adding a data request
4. Configure your request and the polling interval as you want. You should specify HTTP request parameters in the "Request string" field, like "param1=value1¶m2=value2". If your request does not have parameters, you should add any empty parameter anyway (e.g., p=1).
The polling interval value should be enough to connect to a sensor and retrieve a full response (more than 1-2 seconds).
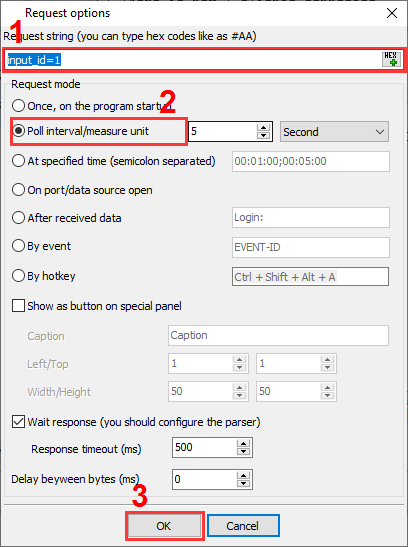
Fig. 4: Defining data request settings
5. Change data view mode settings to display plain text data and highlight outgoing requests. Then you may see this data in the main window. Outgoing requests are highlighted by the yellow color.
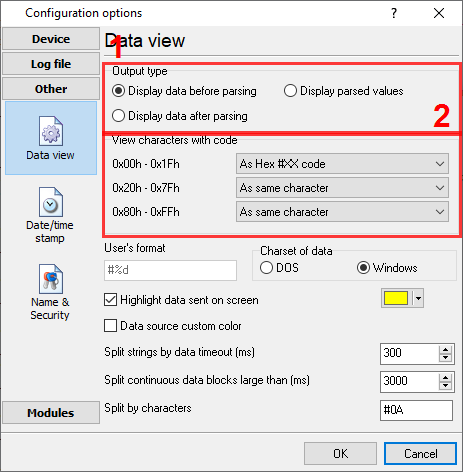
Fig. 5: Data view mode settings
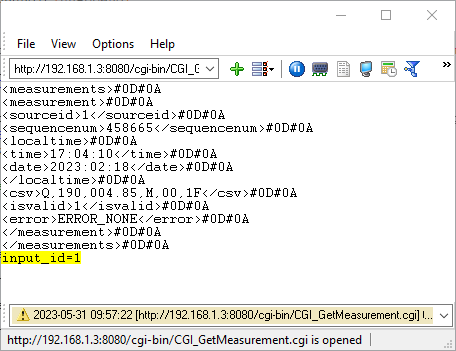
Fig. 6: Outgoing requests and incoming data
6. MetStream can return XML or JSON data in a response stream. This tutorial shows how to extract the necessary values using regular expressions.
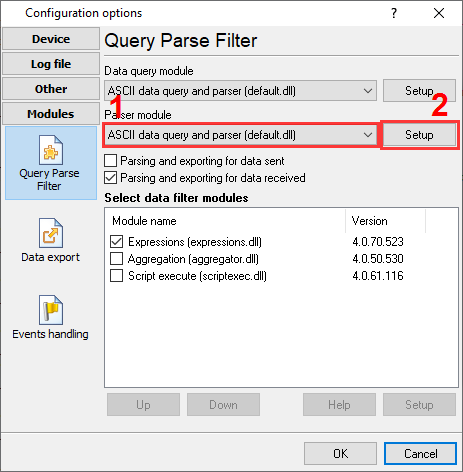
Fig. 7: Selecting a data parser plugin
First, we should extract a data packet between <measurement> and </measurement> signatures.
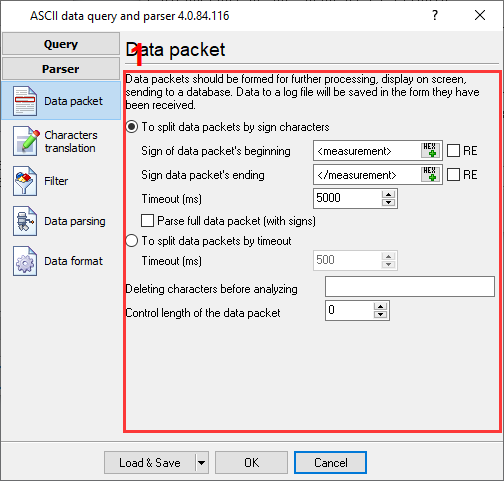
Fig. 8: Rules to extract a whole data packet from a response
Last, we should extract the necessary values to separate parser variables.
Regular expressions:
- SOURCEID (device ID): <sourceid>(.+?)</
- SEQUENCENUM (measurement sequence number): <sequencenum>(.+?)</
- LOCAL_TIME (measurement time): <time>(.+?)</
- LOCAL_DATE (measurement date): <date>(.+?)</
- Extract data from the <csv> XML node value:
- WIND_DIRECTION: <csv>[^\,]+,([^\,]+)
- WIND_SPEED: <csv>[^\,]+,[^\,]+,([^\,]+)
- IS_VALID (data validity flag): <isvalid>(.+?)</
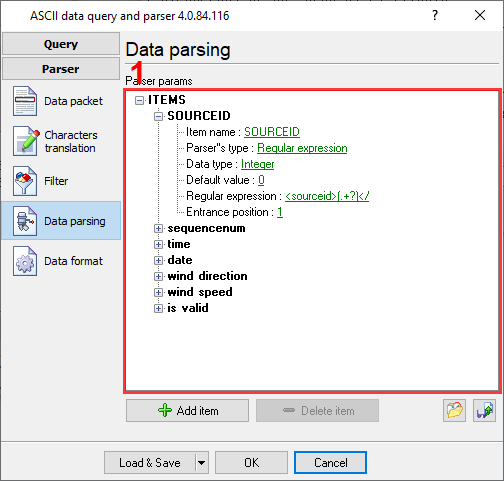
Fig. 9: Data parsing
7. Before exporting data, you can check it in the DDE or OPC server plugin (you need to enable it before receiving data).
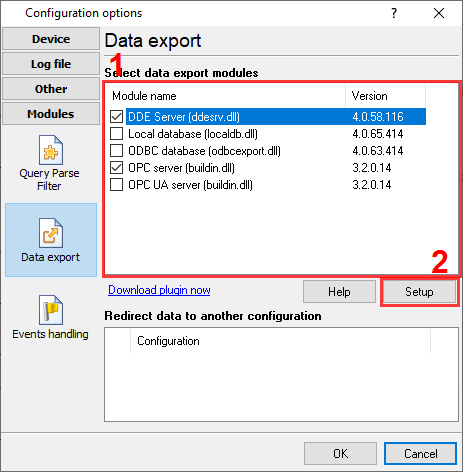
Fig. 10: Selecting the DDE server export plugin
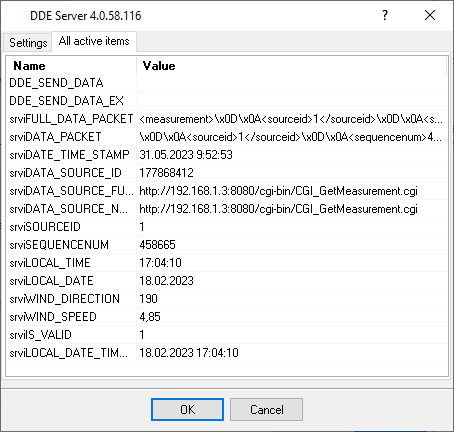
Fig. 11: Parsed data